

- A typical B2B new-business win rate is around 18 to 21%, while expansion deals win around 45% of the time (Ebsta)
- Calculate conversion at every stage by dividing the number that reached the next stage by the number at the current stage, then multiplying by 100
- Benchmarks differ because of definitions, deal size and samples, so compare against your own past performance first
- In trumpet's data, Pods with a Mutual Action Plan double their win rate, and plans with 11 to 15 completed steps reach a 92% win rate
- More engaged stakeholders and more buyer revisits are both linked to higher win rates and shorter sales cycles
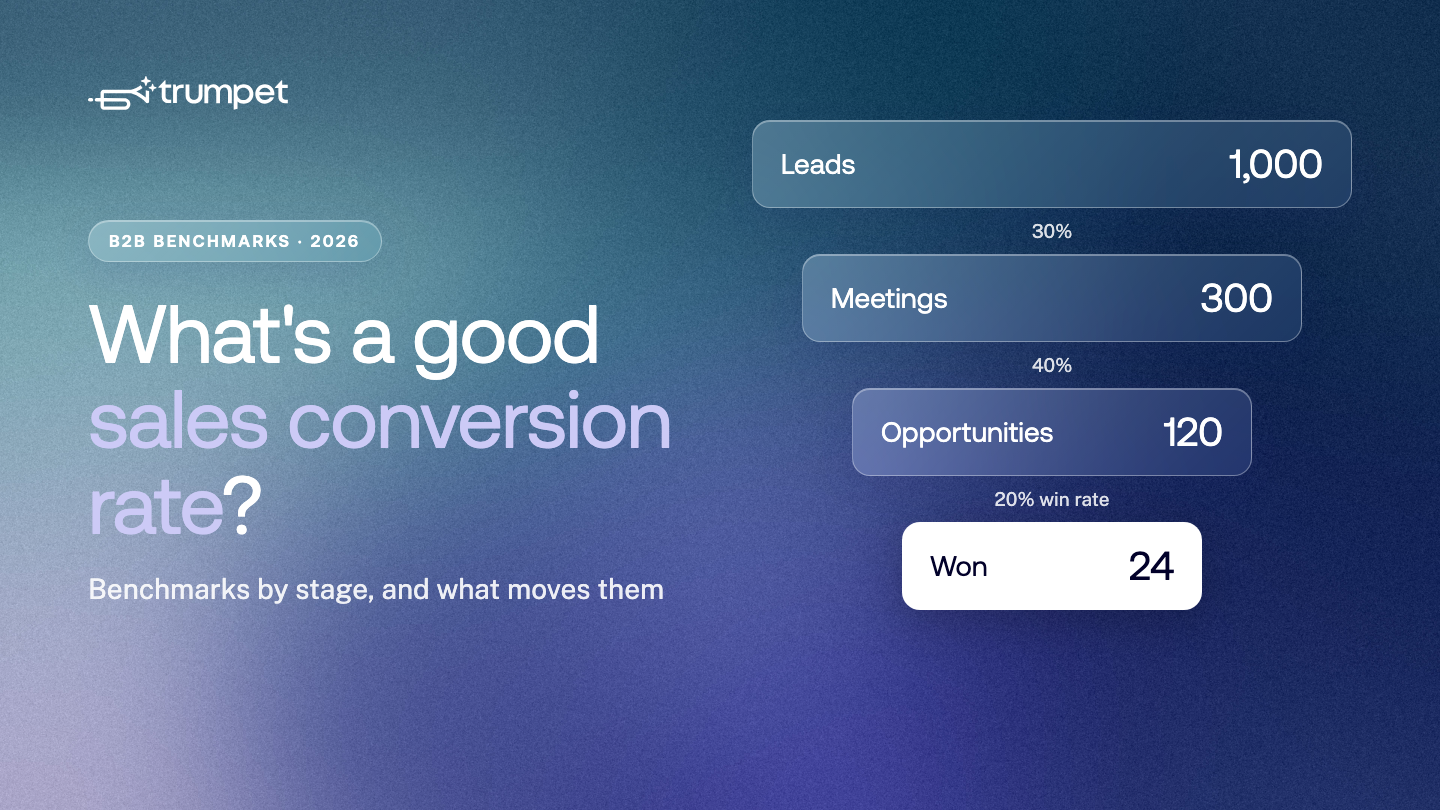
In B2B sales, a good conversion rate depends on the stage you're measuring, but a typical new-business win rate (opportunities that close) is around 18 to 21%, and expansion deals with existing customers win around 45% of the time. Overall lead-to-customer rates are much lower, often in the low single digits, because most leads drop out before they become opportunities.
This guide explains how to calculate sales conversion rates at each stage of a B2B funnel, the benchmarks worth comparing against, and what the data says actually moves them.
What is a sales conversion rate in B2B?
A sales conversion rate is the percentage of prospects that move from one stage of your sales process to the next. In B2B, you'll usually track three types:
- Stage conversion rate: the share of leads, meetings or opportunities that progress to the next stage
- Win rate: the share of qualified opportunities that end in a signed deal
- Lead-to-customer rate: the share of all leads that eventually become customers
Win rate is the one most sales leaders focus on, because it shows how well the team turns real pipeline into revenue.
How do you calculate a sales conversion rate?
Use the same formula at every stage:
Conversion rate (%) = (number that reached the next stage ÷ number at the current stage) × 100
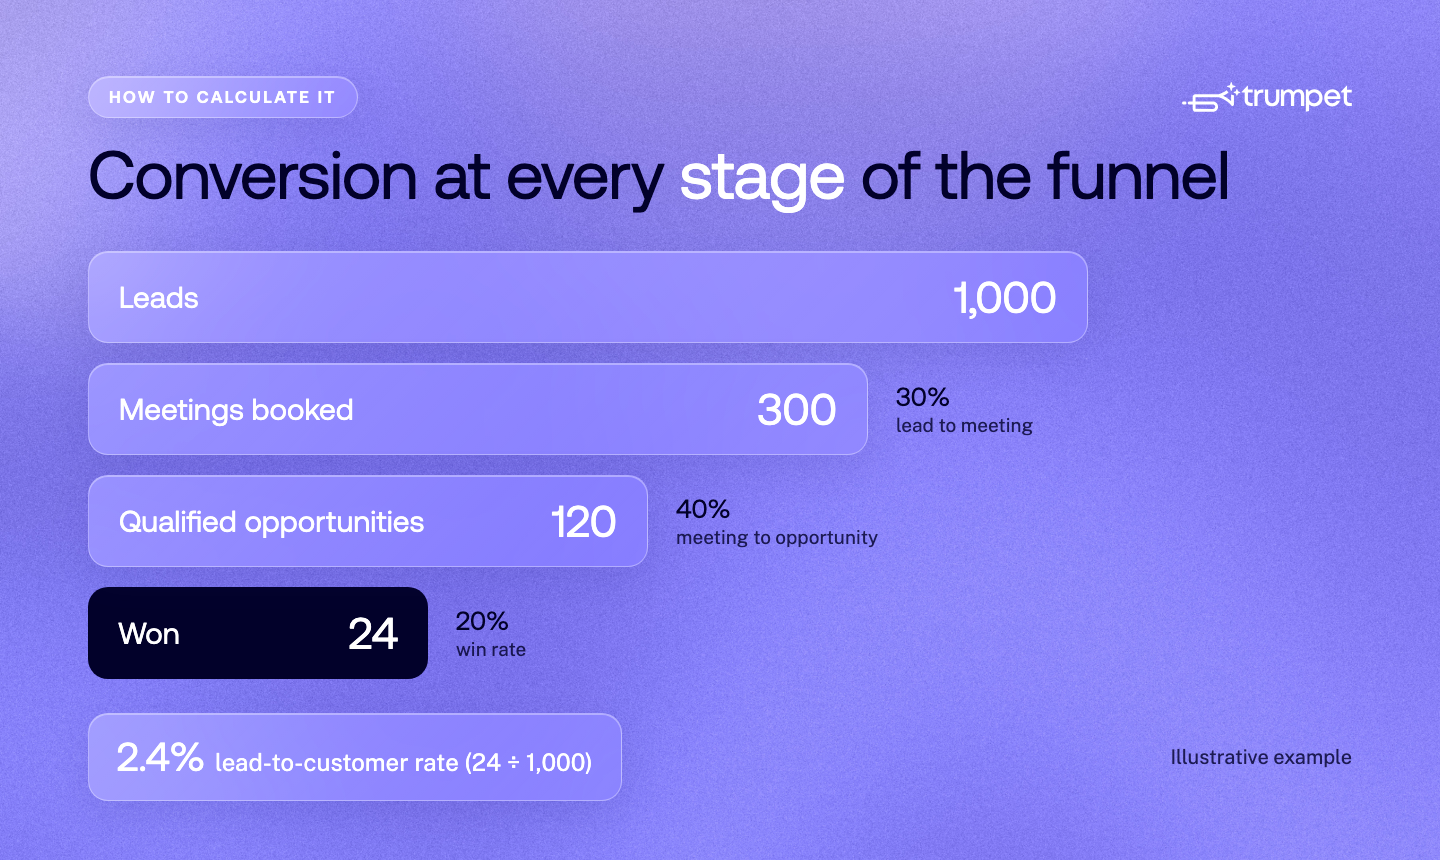
Here's a worked example for one quarter:
- 1,000 leads, of which 300 book a meeting: 30% lead-to-meeting rate
- 300 meetings, of which 120 become qualified opportunities: 40% meeting-to-opportunity rate
- 120 opportunities, of which 24 close as won: 20% win rate
- 24 customers from 1,000 leads: 2.4% lead-to-customer rate
Be consistent about what you count. Some teams calculate win rate as won deals divided by all opportunities created, and others divide by deals closed (won plus lost). Pick one definition, write it down, and use it every time, or your trend lines will mislead you.
What is a good sales conversion rate in B2B?
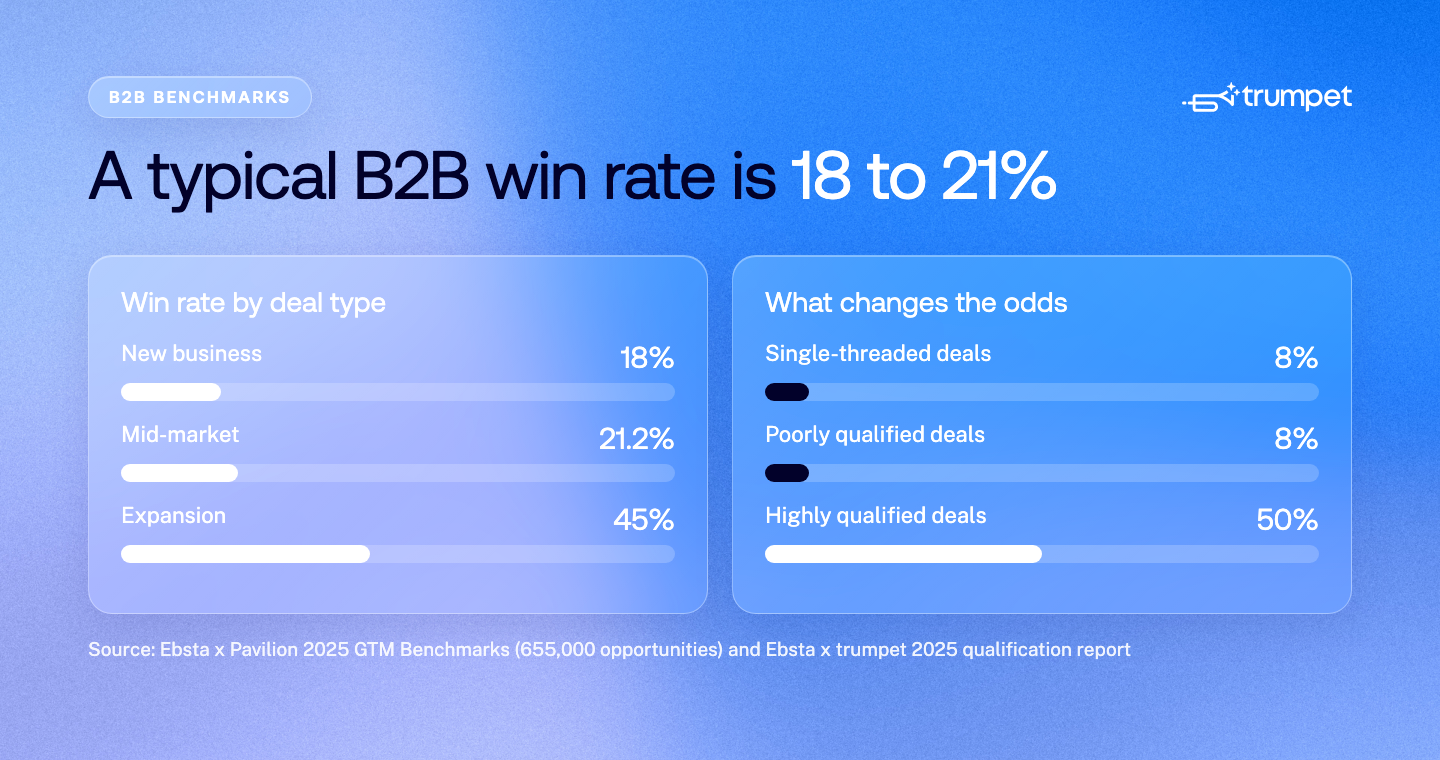
These are the most credible recent benchmarks we could find, all checked against the original source in October 2026:
| Metric | Benchmark | Source |
|---|---|---|
| New-business win rate | 18% | Ebsta x Pavilion 2025 GTM Benchmarks (655,000 opportunities, UK and US tech companies) |
| Expansion win rate | 45% | Ebsta x Pavilion 2025 GTM Benchmarks |
| Mid-market win rate | 21.2% | Ebsta ($48bn of UK and US pipeline) |
| Single-threaded deals | 8% close | Ebsta |
| Poorly vs highly qualified deals | 8% vs 50% close | Ebsta x trumpet qualification report, 2025 |
| B2B SaaS stage rates | Lead to MQL 39%, MQL to SQL 38%, SQL to opportunity 42%, opportunity to close 37% | First Page Sage, based on the agency's anonymised client data, 2017 to 2025 |
Why do benchmarks disagree? Mostly definitions and samples. CRM-based studies like Ebsta's measure every opportunity a team opens, which pulls win rates down to around 18 to 21%. Agency figures like First Page Sage's come from client funnels and measure later-stage deals, so they run higher. Deal size, new business versus expansion, and how strictly a team qualifies all move the number too. The most useful benchmark is your own rate last quarter.
What actually improves B2B sales conversion rates?
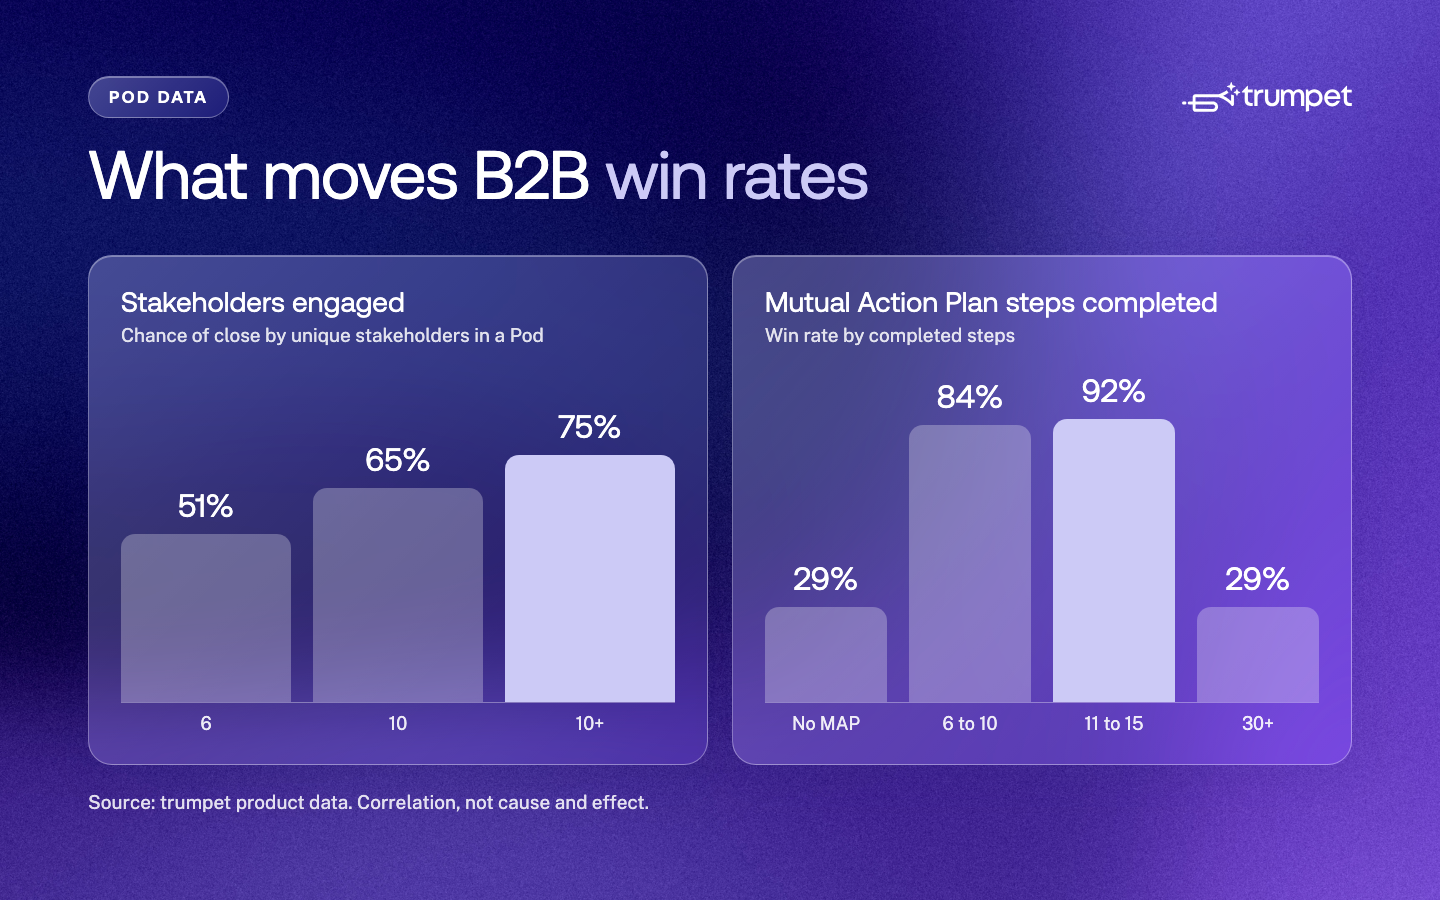
The figures in this section come from trumpet's analysis of its own Pod data (Pods are trumpet's Digital Sales Rooms) unless another source is named. They show correlation, not cause and effect, but the patterns are consistent.
1. Multi-thread every deal
Deals with more engaged stakeholders close far more often. In trumpet's data, getting 4 unique stakeholders into a Pod doubles the chance to close compared with 1 or 2. Six stakeholders gives a 51% chance of close, 10 gives 65%, and more than 10 gives 75%. Gong's analysis of 1.8 million deals found that multi-threading lifts win rates by an average of 130% on deals over $50K, and Ebsta found that only 8% of single-threaded deals close.
That matters because buying groups are big. Forrester's State of Business Buying 2026 found the average purchase involves 13 internal stakeholders and 9 external influencers.
2. Use a Mutual Action Plan, but keep it focused
Pods with a Mutual Action Plan double their win rate against a 29% baseline. Plans with 6 to 10 completed steps have an 84% win rate, and plans with 11 to 15 completed steps reach 92%. Past 30 steps, win rates fall back to the level of deals with no plan at all, so aim for between 6 and 20 steps.
3. Get buyers coming back
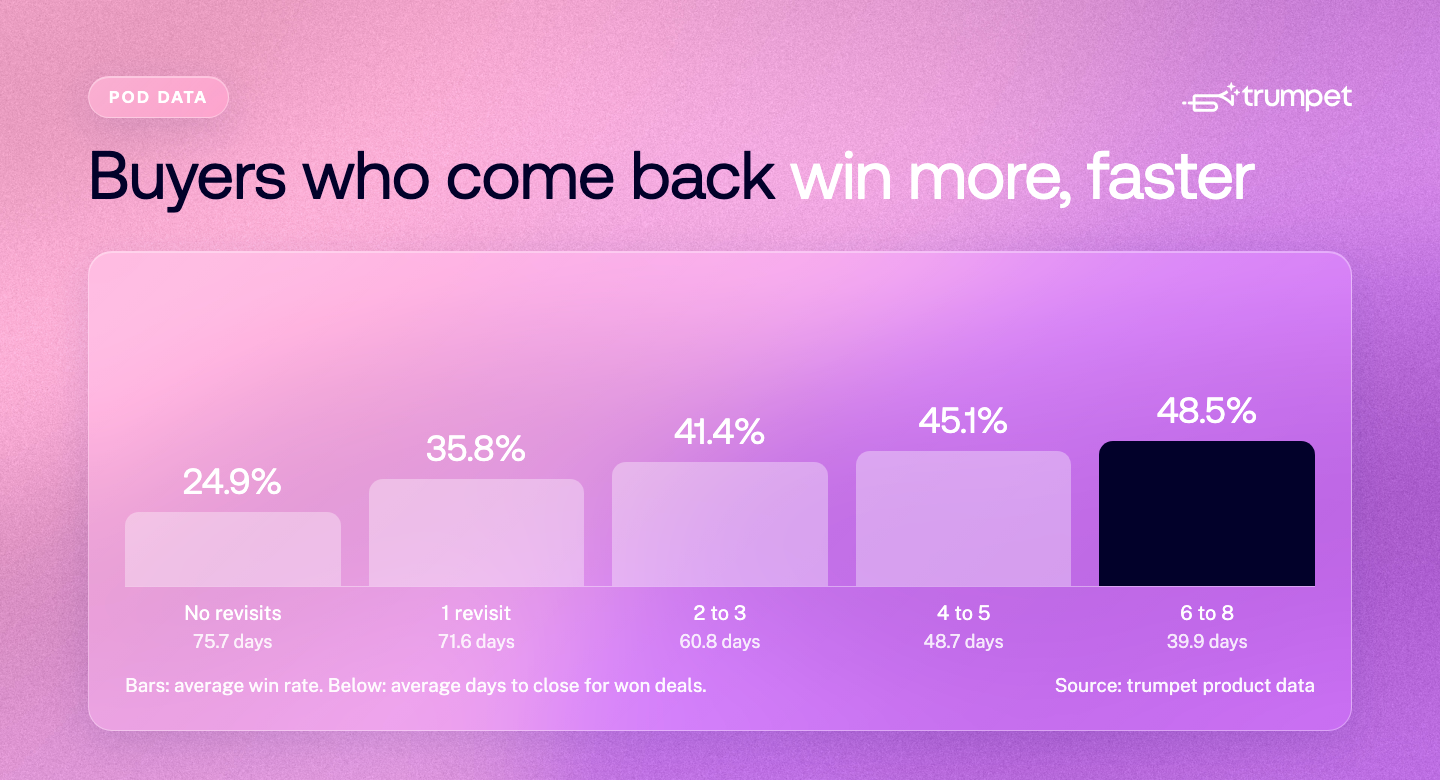
Buyers who return to your content are buyers who are still evaluating. In trumpet's data:
| Revisits by any viewer | Average win rate | Average days to close (won deals) |
|---|---|---|
| None | 24.9% | 75.7 |
| 1 | 35.8% | 71.6 |
| 2 to 3 | 41.4% | 60.8 |
| 4 to 5 | 45.1% | 48.7 |
| 6 to 8 | 48.5% | 39.9 |
Use Insights and Signals to see who's coming back, and follow up while the deal is warm.
4. Bring the right roles in early
Which roles you involve matters as much as how many. Compared with deals where the role isn't brought in alongside the champion, trumpet's data shows win rates rise by 83% when procurement is involved, 70% with security, 51% with finance (excluding the CFO) and 47% with marketing. Procurement also lengthens the cycle by 48%, so bring them in early rather than at the end. Combinations work even better: deals that involve the C-suite, sales, marketing and IT together see win rates rise by 158%.
5. Qualify harder
Ebsta and trumpet's 2025 qualification report found that well-qualified deals are 6.3 times more likely to close: 50% for highly qualified deals against 8% for poorly qualified ones. Highly qualified deals also closed in an average of 71 days, against 91 for the average deal.
6. Give buyers the right content, not more content
- A deal timeline in the Pod sped up sales cycles by 33% and lifted win rates by 7%
- Interactive demos sped up sales cycles by 31%
- Clear pricing sped up sales cycles by 19%, and when prospects spent 2 to 10 minutes on the pricing page, win rates rose by 34%
- More than 3 PDFs in a Pod lowered win rates by 8%
For what to include at each stage, see our guide to Digital Sales Room Templates.
How should you track sales conversion rates?
- Track every stage, not just win rate. A drop in meeting-to-opportunity conversion tells you something different from a drop in win rate.
- Split new business from expansion. Expansion deals win far more often, so blending them hides problems in new business.
- Segment by deal size and source. Enterprise and inbound deals behave differently from SMB and outbound.
- Watch leading indicators. Stakeholder count, Mutual Action Plan progress and buyer revisits move before the win rate does.
- Review monthly, compare quarterly. Monthly reviews catch problems early, and quarterly comparisons smooth out noise from a few large deals.
FAQs
What is a good sales conversion rate for B2B?
For new-business opportunities, a win rate of around 18 to 21% is typical, based on Ebsta's analysis of 655,000 opportunities. Expansion deals win around 45% of the time. Overall lead-to-customer rates are usually in the low single digits.
What's the difference between win rate and conversion rate?
Conversion rate can describe any stage of the funnel, such as lead to meeting. Win rate is specifically the share of qualified opportunities that end in a signed deal.
How do you calculate a sales conversion rate?
Divide the number of prospects that reached the next stage by the number at the current stage, then multiply by 100. For example, 24 won deals from 120 opportunities is a 20% win rate.
Why is my conversion rate different from published benchmarks?
Benchmarks use different definitions, deal sizes and samples. Compare yourself against your own past performance first, and use external benchmarks as a rough guide.
What's the fastest way to improve win rates?
Multi-thread your deals. In trumpet's data, getting 4 stakeholders engaged doubles the chance to close compared with 1 or 2, and Ebsta found that only 8% of single-threaded deals close.
Sources
- Ebsta x Pavilion, 2025 GTM Benchmarks
- Ebsta, 5 insights to improve your win rate
- Ebsta x trumpet, Driving profitable growth through smarter qualification (2025)
- Gong, Data shows top reps don't just sell, they orchestrate
- Forrester, The State of Business Buying 2026
- First Page Sage, Sales funnel conversion rate benchmarks
- Trumpet product data on Pods, stakeholders, Mutual Action Plans, revisits and content


See what your buyers are doing between meetings
Build a Pod, share it with the buying committee and watch the signals roll in. Free to start.