

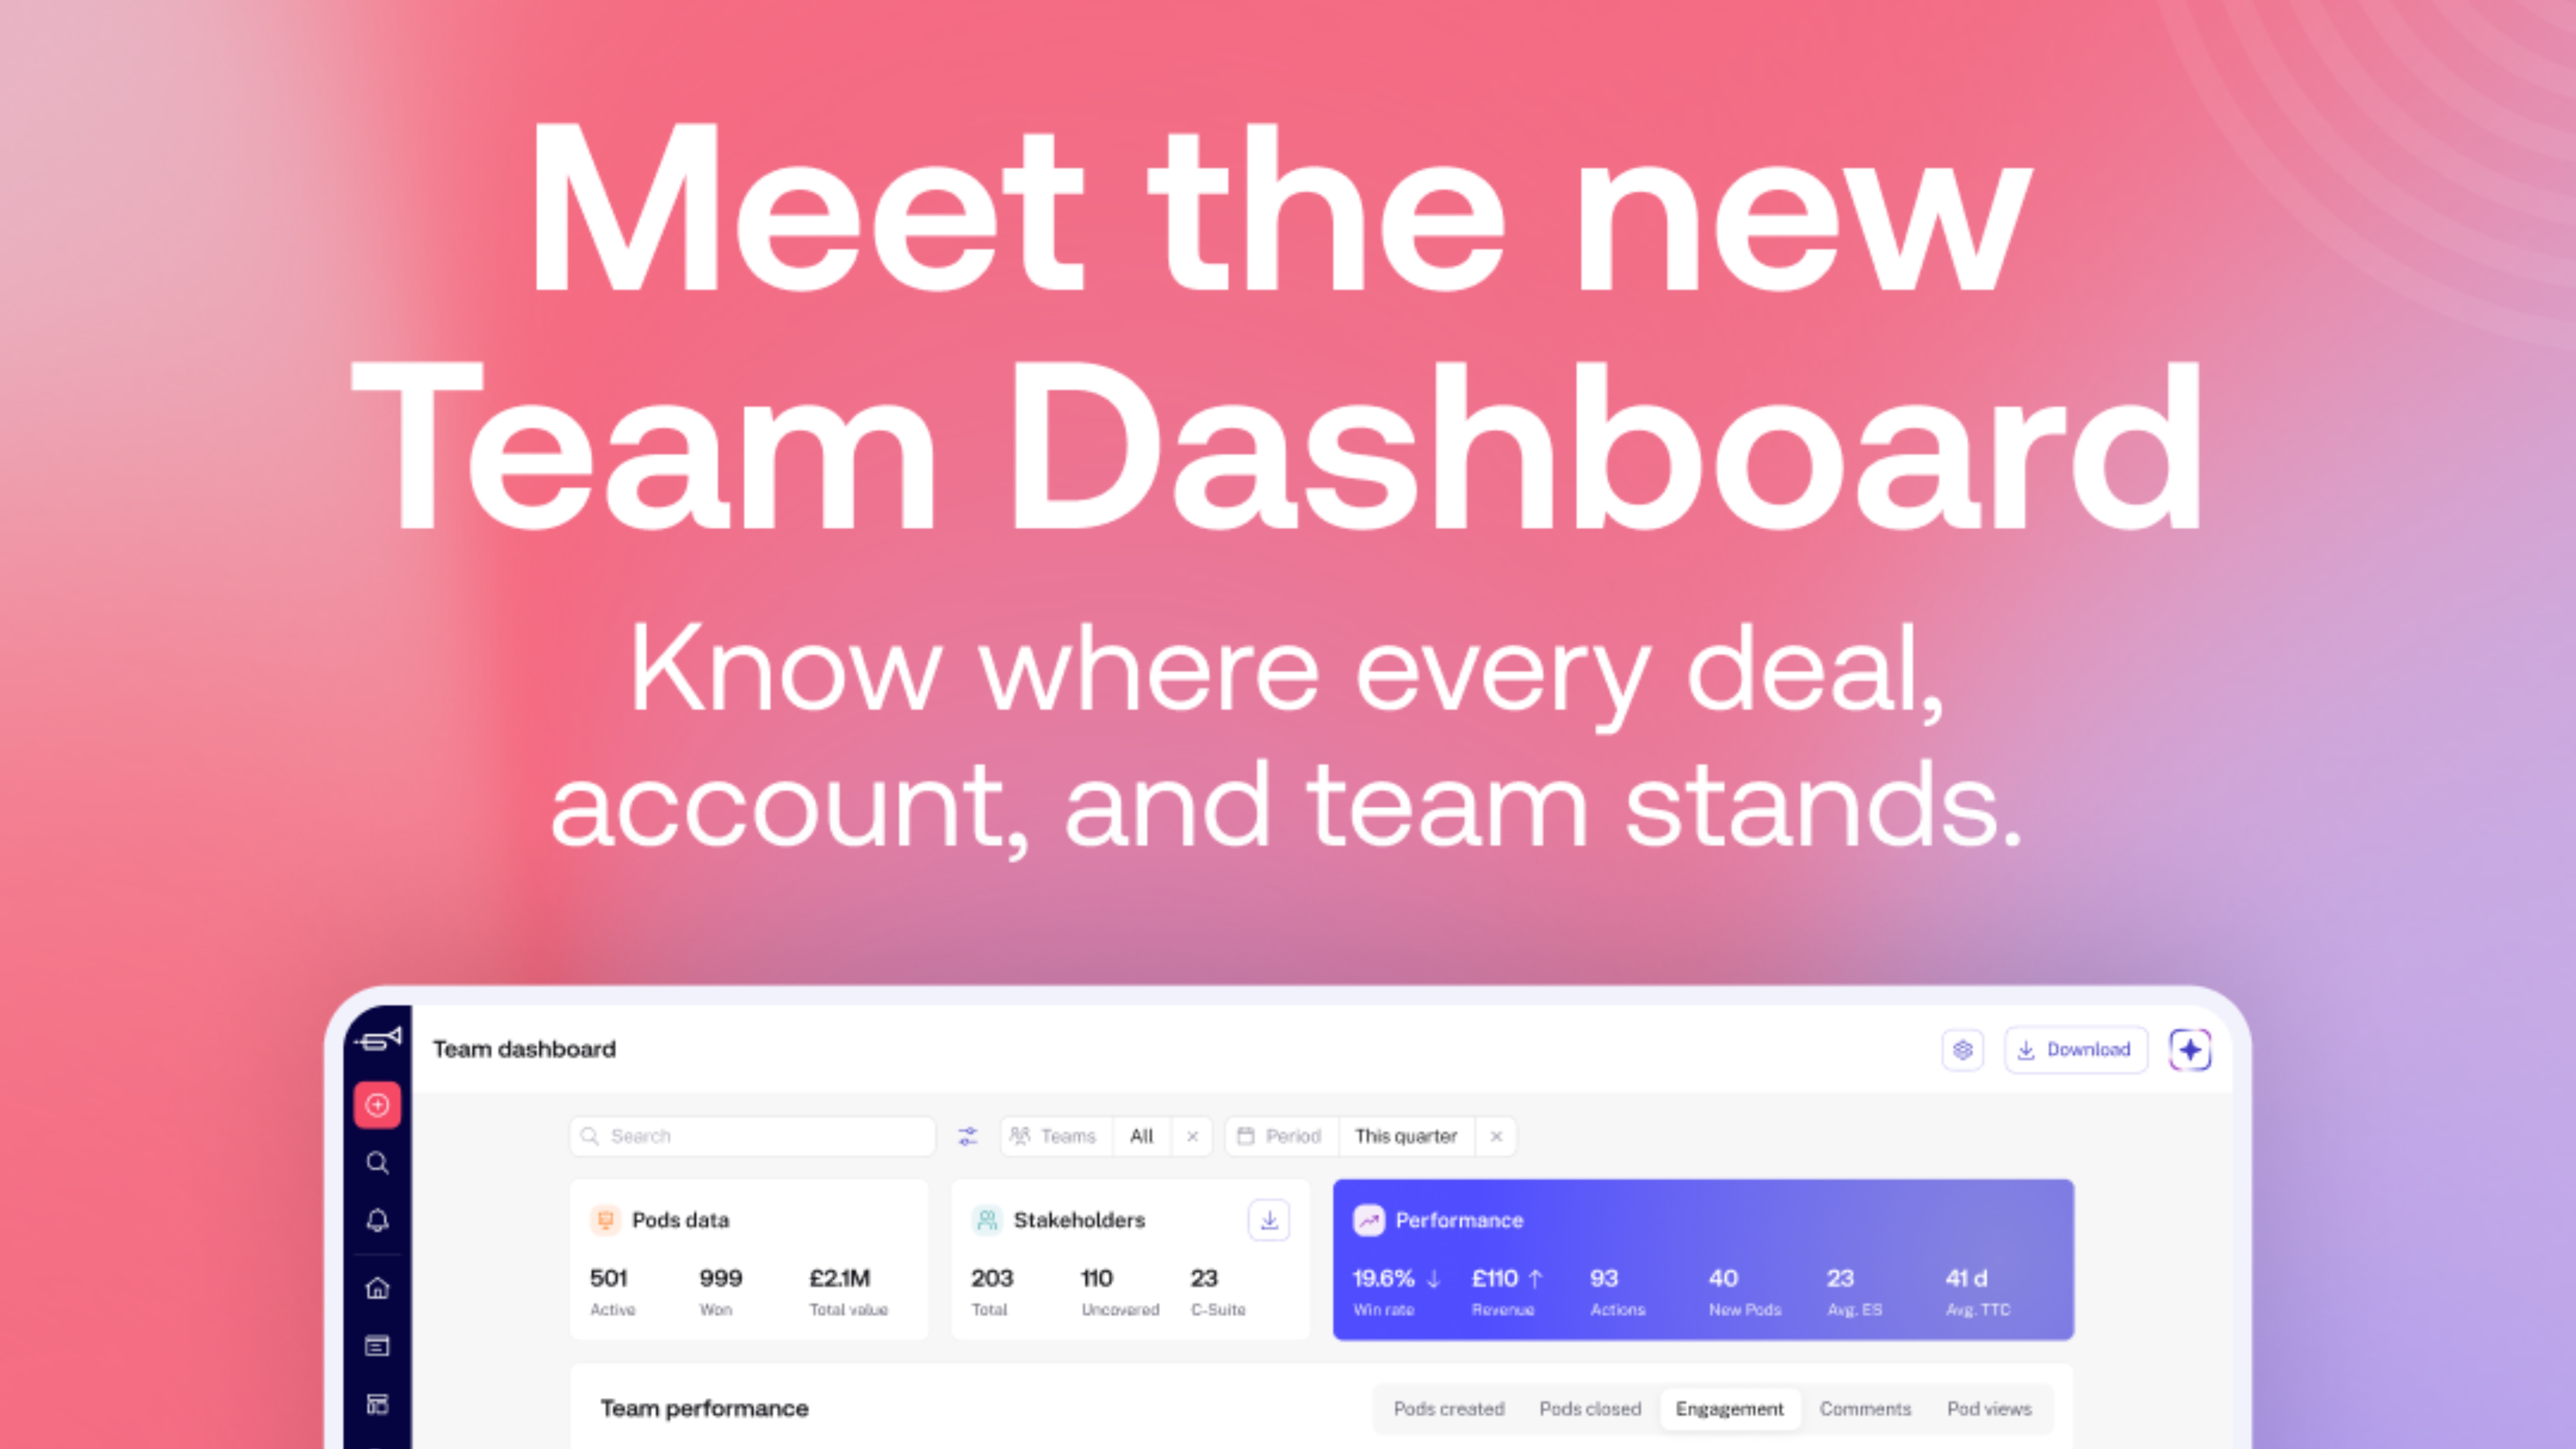


We've rebuilt Team Dashboard designed to help revenue teams understand deal momentum, buyer engagement, and account activity in one place
• New Closing Soon view surfaces deals, renewals, and accounts that may need attention based on engagement, stakeholder activity, and close dates
• Team and individual drill-down reporting helps managers compare performance, identify trends, and coach with better context
• Workflow improvements like saved views, persistent filters, search, and exports make regular reporting faster and easier
Most revenue teams already have access to plenty of data. CRM records, activity dashboards, pipeline views, the reporting infrastructure is usually there. But that doesn’t always make it easier to understand what’s actually happening.
Managers are often jumping between tools and tabs, just to piece together a clear picture before a team meeting or forecast review.
A CRM might tell you a deal is still active, but it won’t tell you that buyer engagement has dropped off, that stakeholder activity has gone quiet, or that momentum has quietly shifted somewhere else. That information is sitting in engagement patterns, viewer behaviour, and activity between calls - the kind of signals that rarely surface in a standard pipeline report.
The problem usually isn’t a lack of reporting. It’s a lack of visibility and context. That’s exactly what we set out to fix when we rebuilt Team Dashboard in trumpet.
The signals that actually matter
Think about what a CRM can tell you about a deal in progress: close date, stage, value. What it can’t tell you is whether the buyer is still engaged. Whether the right stakeholders have seen the proposal. Whether someone else is quietly revisiting the Pod every day, or whether it’s gone completely cold.
Those are the signals that change how a manager should act. And for most teams, surfacing them means manually checking individual workspaces, pulling separate reports, or relying on gut feel.
"Which deals actually need attention this week? Which rep is building real momentum, and which one needs support? And what’s actually working across the team?"
These shouldn’t be hard questions to answer. But for most revenue leaders, they still are.
Know where to focus this week
Not every deal needs attention at the same time. The new ‘Closing Soon’ view helps managers quickly identify the deals, renewals, onboarding journeys, and active accounts that may need intervention, without manually checking Pods one by one.
Close dates sit alongside engagement score, stakeholder activity, viewer time, and deal value in a single ranked table. Sortable, filterable, and fast to scan.
For sales teams, that means clearer prioritisation across active opportunities and a faster read on which deals need support. For customer success teams, it means staying ahead of onboarding risk and renewals before they require urgent attention.
Understand what’s actually driving momentum
One of the harder questions for revenue leaders is understanding why some teams or individuals consistently outperform others. More often than not, the answer isn’t in the activity metrics, it’s in the engagement patterns.
The new Team Dashboard makes it easier to compare teams, groups, and individuals over time. Track Pod views, comments, revenue movement, engagement score, and buyer activity side by side. Overlay up to five teams in a single chart to see who’s leading, who’s lagging, and what the gap looks like across any time period.
The goal isn’t more reporting. It’s making best practice easier to spot, name, and repeat across the team.
Coach reps with real context
The most effective 1:1s happen when a manager already knows the story before the conversation starts.
Click into any team member to open their individual layer: personal metrics, engagement trends, active Pods, and direct performance comparison against the team average or a specific peer group. Variance is highlighted clearly, so it’s immediately obvious where someone is ahead, where they’re behind, and what the gap looks like.
That context changes the quality of a coaching conversation. Instead of reviewing numbers together, managers can ask the right questions and reps get feedback grounded in real buyer behaviour, not surface-level activity.
The smaller things that make work easier
Alongside the larger updates, a few workflow improvements reduce the friction of regular reporting:
- Filters persist across the entire dashboard set them once, they follow you
- Saved views mean regular reporting slices are one click away
- Search makes it faster to find Pods, owners, and teams
- Exports: PDF for dashboard data, CSV for stakeholder data, make sharing easy
Small changes, but the kind that save time every single week.
Built for how revenue teams actually work
Revenue teams don’t need another static dashboard that simply reports on pipeline numbers. They need a clearer understanding of where momentum is building, which deals need support, how buyers are engaging, and where managers should focus next.
The new Team Dashboard is designed to bring those signals together in one place, so managers can prioritise faster, coach with better context, and understand what’s really happening across their accounts and opportunities.
Whether you’re preparing for a pipeline review, running a rep 1:1, or trying to understand why one team is consistently outperforming another, Team Dashboard gives you a single picture to work from.
Frequently Asked Questions
What is Team Dashboard in trumpet?
Team Dashboard is a reporting and visibility workspace inside trumpet that helps revenue teams monitor deal momentum, buyer engagement, account activity, and team performance across Pods. It has two layers: a Team Layer for company-wide performance, and an Individual Layer for per-rep breakdowns and peer comparison.
What is the Closing Soon view?
Closing Soon is a deal-level table that surfaces deals, renewals, onboarding journeys, and accounts that may need attention based on close dates, engagement score, stakeholder activity, viewer time, and deal value. It’s sortable and filterable, so managers can quickly identify where to intervene.
How does Team Dashboard help sales managers?
Sales managers can use Team Dashboard to prioritise deals, run more effective 1:1s using real engagement data, identify deal risk earlier, and compare team performance over time. The Individual Layer lets managers drill into any rep and see their metrics against team averages and specific peer groups.
Can customer success teams use Team Dashboard?
Yes. Customer success teams can monitor onboarding progress, account engagement, renewals, and customer momentum across active accounts and use the Closing Soon view to stay ahead of key moments before they become urgent.
What metrics can teams track?
Teams can track engagement score, stakeholder activity, viewer time, revenue movement, active Pods, comments, buyer behaviour, win rate, and performance trends, across teams, individuals, and time periods. Comparative analytics let managers see % variance against team average or specific peer groups.


![How to Get Started with Buyer Enablement [With Examples]](https://cdn.prod.website-files.com/65cf4fecbed2754c2236665d/65cf4fecbed2754c22366bdb_65a5af83e742f76e34ce06f3_Customer%2520Onboarding%2520_%2520Everything%2520you%2520need%2520(2).png)
.png)


.png)


.png)


.png)


.png)

.png)
.png)


